Multibot
Multibot chart allows to create several data sets in one chart (the data set is pair "core, background").
Thus there is a possibility to place on a chart simultaneously a several natals and a several derivative charts adhered to everyone natals. In particular, it is possible, for example, to look aspects of planets of a progression of one natal to planets of another natal, aspects of a progression of several events to one natal, etc.
The multibot chart with progressions to natas may looks as:
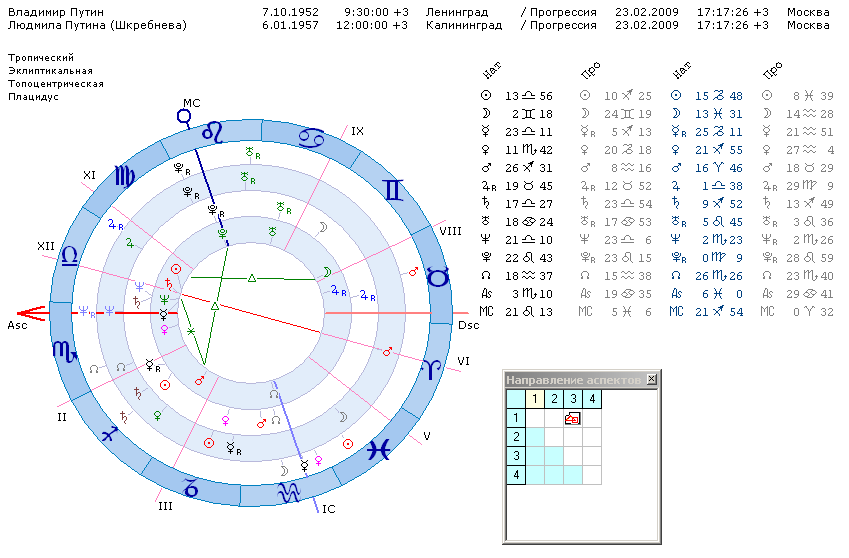
There are two data sets, two progressed charts, i.e. 4 planets rings:
- natal of Vladimir Putin
- progression of this natal to current date
- natal of Ludmila Putin
- progression of this natal to current date
With "Aspect Direction" function (Alt+A keys) established aspecting between natals (1st and 3rt rings), aspected rings colored by blue. Click by mouse to any cell of "Aspect Direction" table, you may get aspecting with any planets rings.
The Multibot mode established by  button
in Event Data window:
button
in Event Data window:
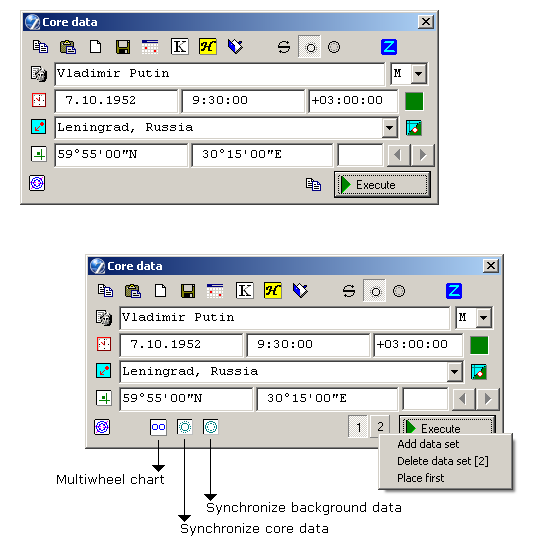
Herewith:
- created second data set (a copy of first) and appears a buttons to reset these data sets for display in "Event Data" window.
- appears buttons of multibot mode control: multiwheel chart, synchronize core data, synchronize background data
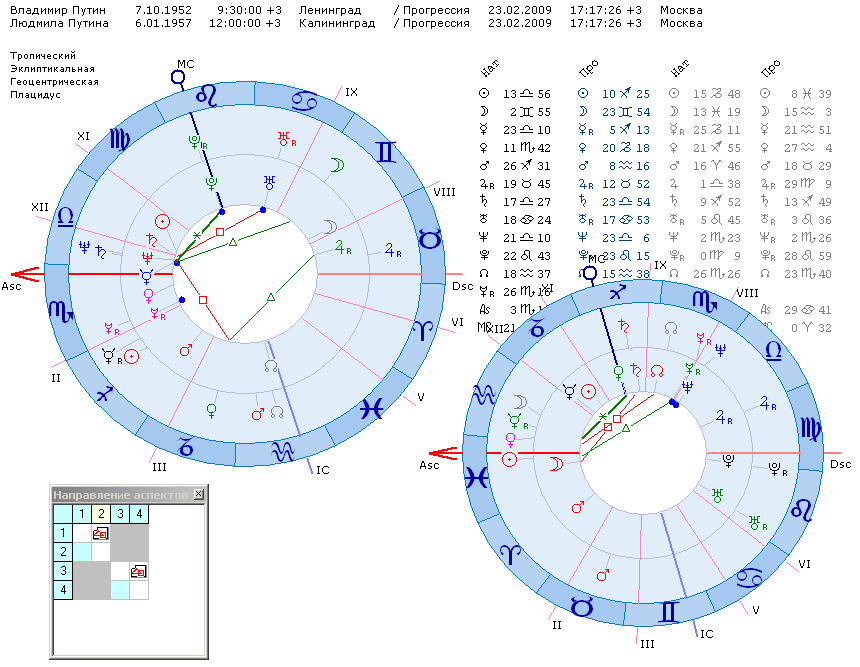
The multiwheel chart mode means several separated charts on a screen, where every chart correspods its own data set. The size and position of each chart (for multiwheel) adjusted separatelly (by mouse). Established sizes and positions are saved (separatelly for each wheels count: 2, 3, ..., 7). Other settings of these charts are same.
The time synchronization mode for core datas of multibot may used e.g. for charts of progressions of several events to one natal in process of birth time changing by rectification.
A buttons to reset of data sets have a popup menu allowes:
- add a data set (up to 7)
- delete specified data set
- remove specified data seo to first place
Adding and removing of data set simultaneously displyed on current chart.
The Chart Type Selector applied for every data set separatelly.