Complex and Fixed Charts
Complex and fixed charts are not available in the Lite or Pro versions of ZET.
A complex chart is a ZET chart which contains more then two rings of planets - up to 7 rings can be mounted concentrically.
For example, a chart displaying the natal, progressed and transiting planet positions for a life event of a nativity:
The wheel can be accompanied by a listing of planets' data, according to the Planets List options specified on the Chart Settings - Data tab - you can elect to list every rings' planets, or a subset i.e. the core (inner) ring and up to two different rings chosen using the Direction of Aspects window.
To highlight the rings selected in the Direction of Aspects window for aspect analysis, selected rings are shown (by default) pale blue and unselected rings white. In the planets list, selected rings' data is displayed in black, unselected rings' data in light-gray. All these colors are user-definable on the Color tab.
In the chart shown, aspects between the natal (#1) and progressed (#2) rings have been selected in the Direction of Aspects window.
Usually rings #2 thru #7 of a complex chart derive from one event, and are calculated using the same date, specified as the background event data. Complex charts, however, can combine charts of other events, or more simply other charts, with those of nativities, e.g. a triple chart containing male and female nativities, and a transit marriage chart. To use additional charts, and to include ones calculated for some date(s) different from either core or background event data, requires 'Fixed' charts (ZET's terminology).
A Fixed chart is fixed in respect of the coordinates of planets and houses in the chart, the coordinates being fixed when the chart is erected and saved. These charts are thus independent of core or background event data. One can therefore explore further the astrological situation of marriage partners mentioned above by including say a coalescent chart of the nativies as ring #4, a chart of their first encounter as ring #5, and so on.
Working with Complex Charts
 To erect a complex chart, open the
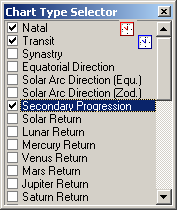
  Chart Type Selector window, and from the list of available chart types checkmark the boxes
for the charts you wish to include.
You can check several check-boxes by pressing Shift key with mouse clicking on check-box,
or double mouse clicking on the item caption (right of check-box).
The chart is created immediately.
Chart Type Selector window, and from the list of available chart types checkmark the boxes
for the charts you wish to include.
You can check several check-boxes by pressing Shift key with mouse clicking on check-box,
or double mouse clicking on the item caption (right of check-box).
The chart is created immediately.
To change the order of rings in a complex chart (except for the first, inner ring), drag and drop items in the Selector list into the desired order with the mouse. To restore the list (and chart) to the initial order, simply click open the Dual Chart Editor window using the button in the Chart Type Selector window, and close it again.
Complex charts are recorded in, and retrieved from, the History log in the same way as normal single and dual type charts.
Working with Fixed Charts
Available fixed charts are displayed in the Chart Type Selector window at the end of the list after in-built types, and are designated with a hash (#) sign. They are inserted in complex charts as described above.
To save a ring of the currently erected chart as a fixed chart:
- Right-click in the Chart tableau to display the popup menu, and select the "Save As Fixed" item,
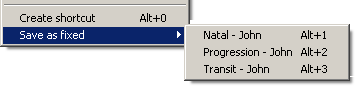
- From the submenu list of rings, choose the ring you want saving.
Alternatively type the Alt+n hot-key, where n is a number from 1 to 7, to save the nth chart ring as a fixed chart.
If the action was successful, a confirmation message window is displayed, and a new entry is added to the Selector's list of chart types.
To view the details of a fixed chart, select it in the
Selector window, right-click its line with the mouse to invoke the pop-up menu:
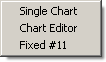
Select last menu item "Fixed..." to display the following window:
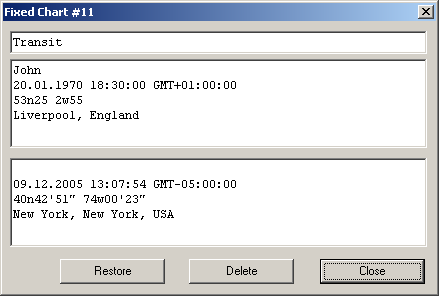
If the fixed chart derived from core and/or background event data, these are shown in the upper and lower of the two large panes of the window respectively. Click the Restore button to erect the chart on the tableau. Fixed charts not corresponding to real planetary positions (e.g. coalescent charts) lack source event details, and cannot be restored in the same way.
To delete a fixed chart, click its list entry in the Chart Type Selector window, right-click to display its information window, and click the Delete button.